Web app for Ingérop: calculating the carbon footprint of buildings 🏘️
Ingérop
Web app
RE2020
Turning an Excel tool into a web app that calculates the carbon footprint of a single building element or an entire project.
Client
Ingérop
Timeline
2024
Deliverables
Desktop & mobile web app, ~50 screens
At a glance
🎯 The challenge
Ingérop wanted to turn an Excel tool into a user-friendly web app to calculate the carbon footprint of buildings, ahead of the RE2020 regulation.
📈 What I brought
A journey that serves two opposite needs: an estimate within seconds with no sign-up, or a full project to come back to later. Around fifty screens, desktop and mobile.
🔧 What I could have done better
At one point I felt stuck: I should have pushed earlier for the in-depth conversation with the client that eventually unblocked everything.
💡 What I learned
When you're stuck, it usually means you haven't fully understood the users' goals yet.
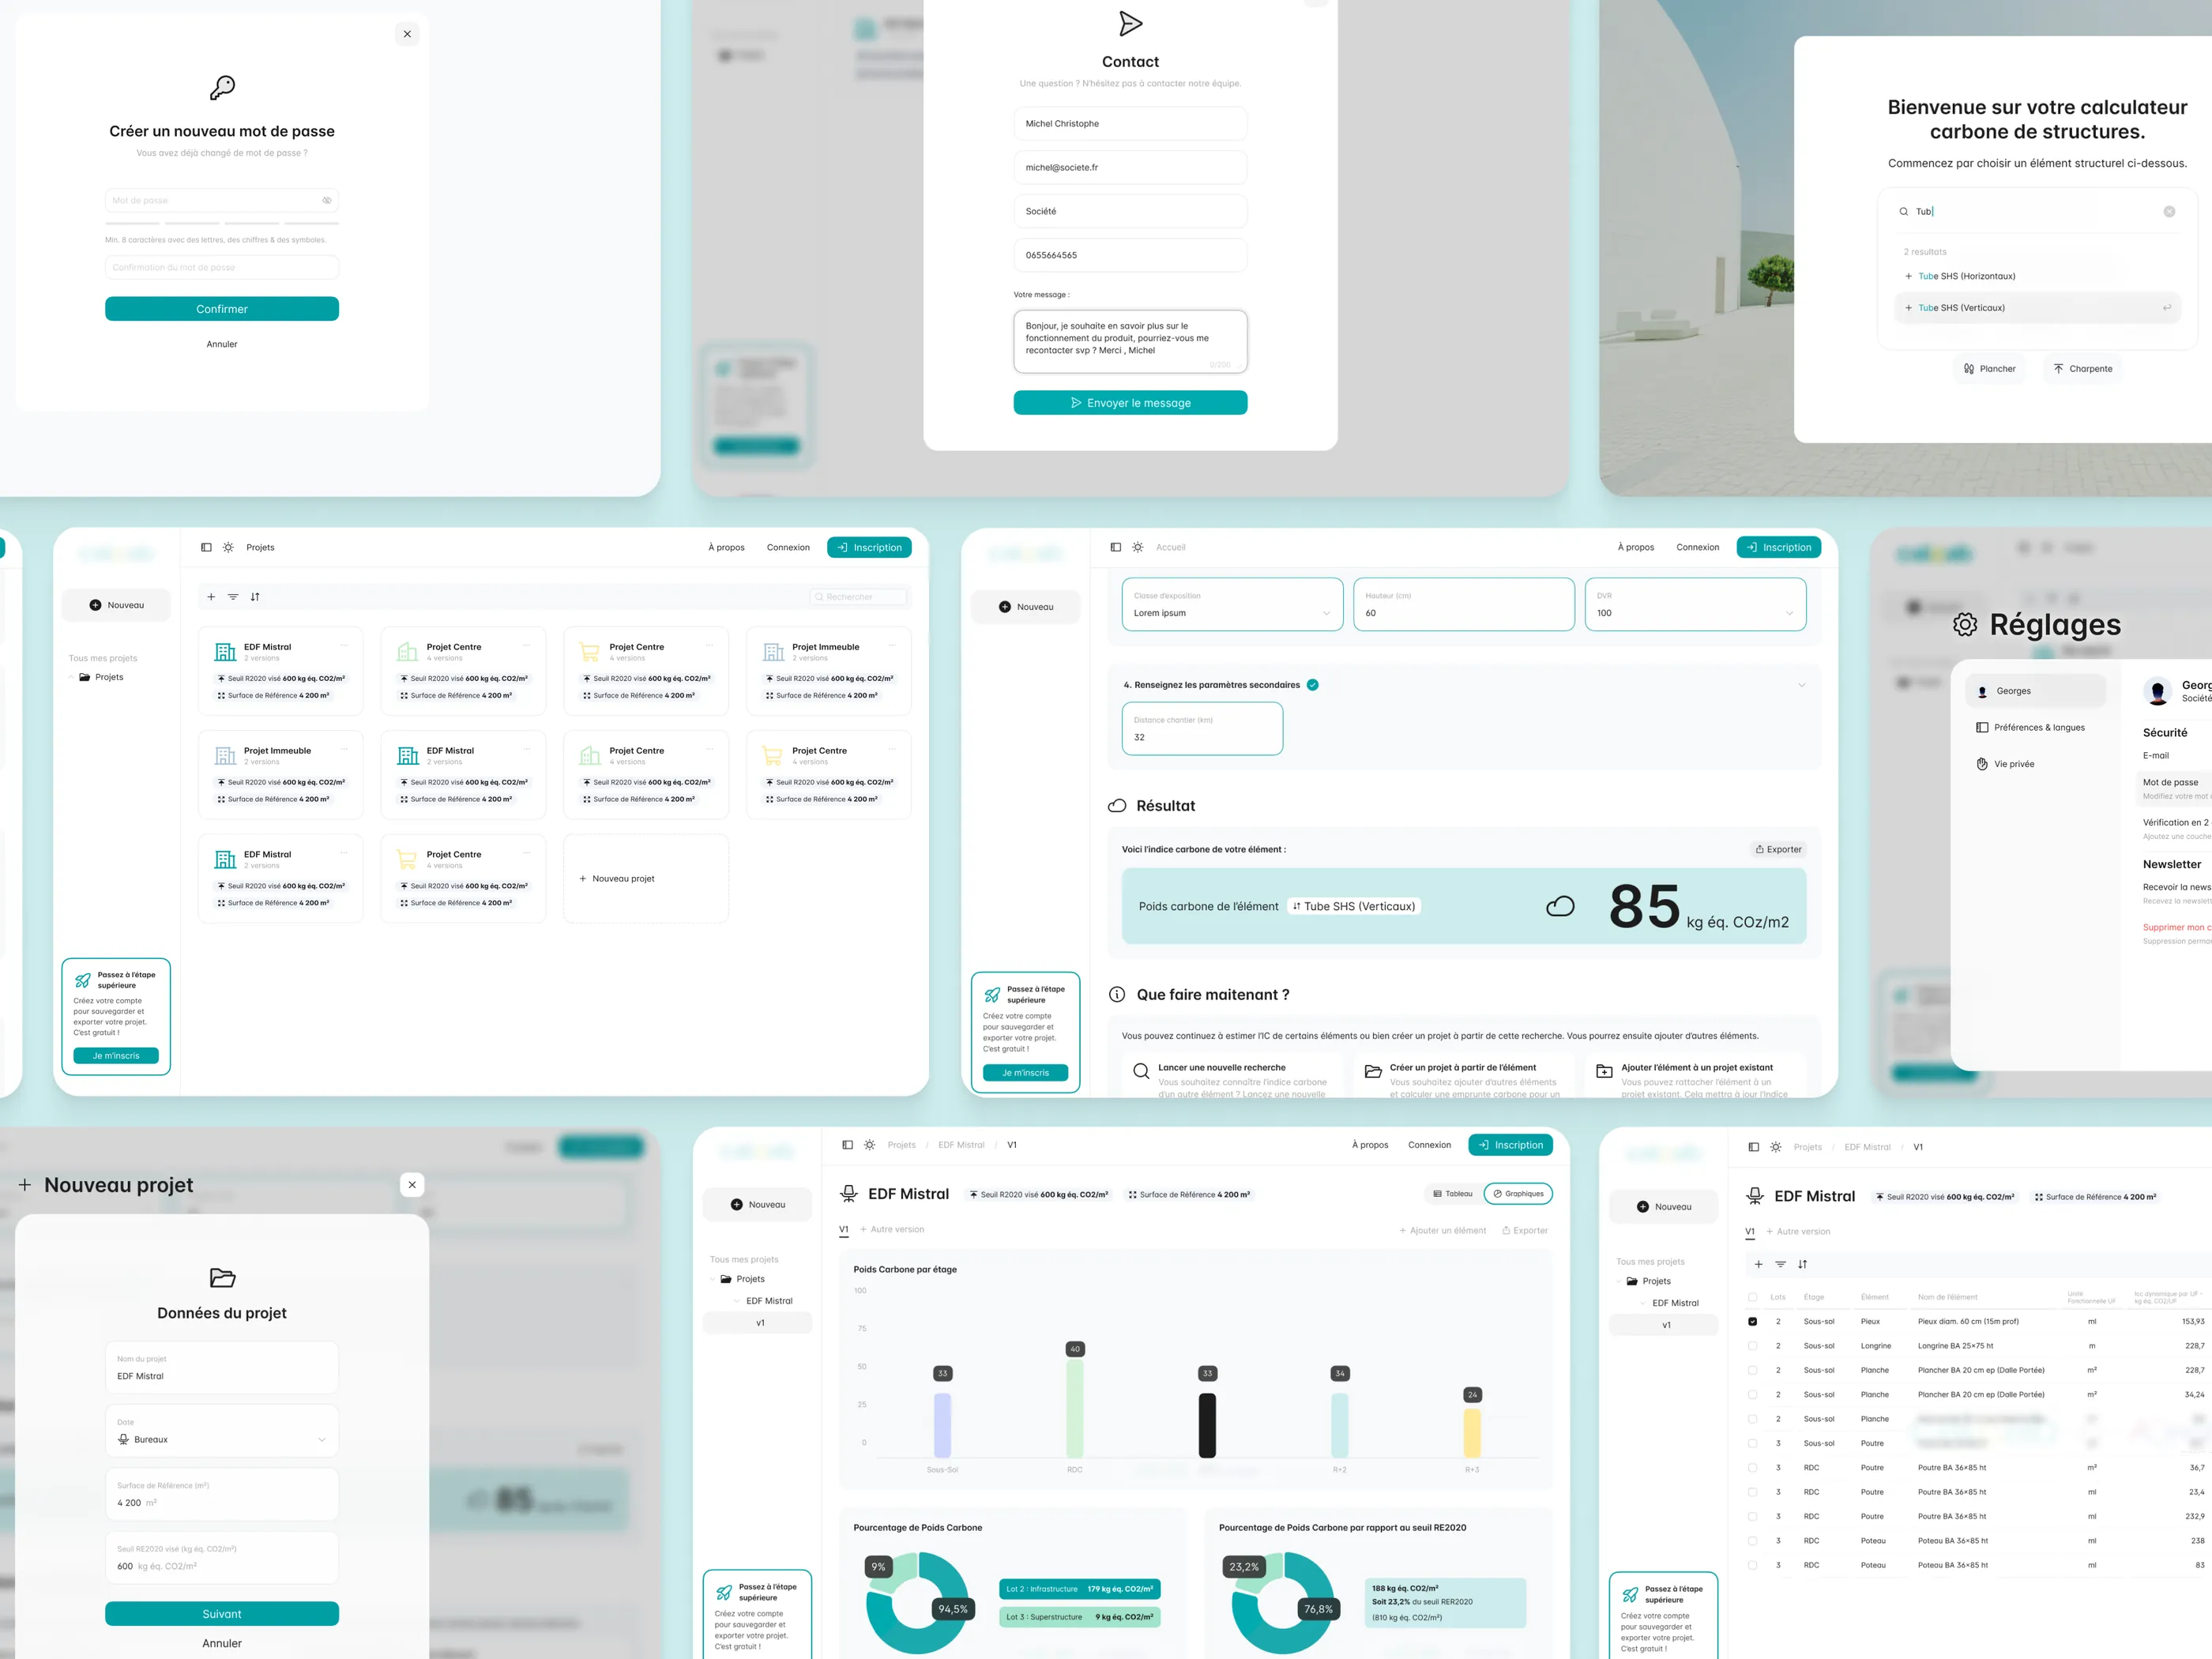
A few of the fifty or so screens I designed.
ℹ️ Good to know: the live version isn't fully developed, but it gives you a good overview: calcab.ingerop.com
Ahead of the RE2020 environmental regulation, engineering firm Ingérop asked me to turn an existing Excel-based tool into a more user-friendly and efficient web app (that also works in mobile browsers).
The goal: let anyone calculate the carbon footprint of a single building element or an entire project.
Something for everyone 🧐
The main challenge on this project was the range of users. Some want to calculate the carbon footprint of a single element, quickly, hassle-free and without signing up, while others want to calculate the footprint of an entire project and be able to find all the information later on.
To meet both needs, I built a user journey that starts by adding a single element. From there, you already get an estimated carbon cost within seconds, no sign-up required.
You're then free to run a new search, or turn that element into a project by adding more.
That way, we cover users' two main needs. It sounds simple on paper, but it took quite a bit of thinking and back-and-forth to get there.
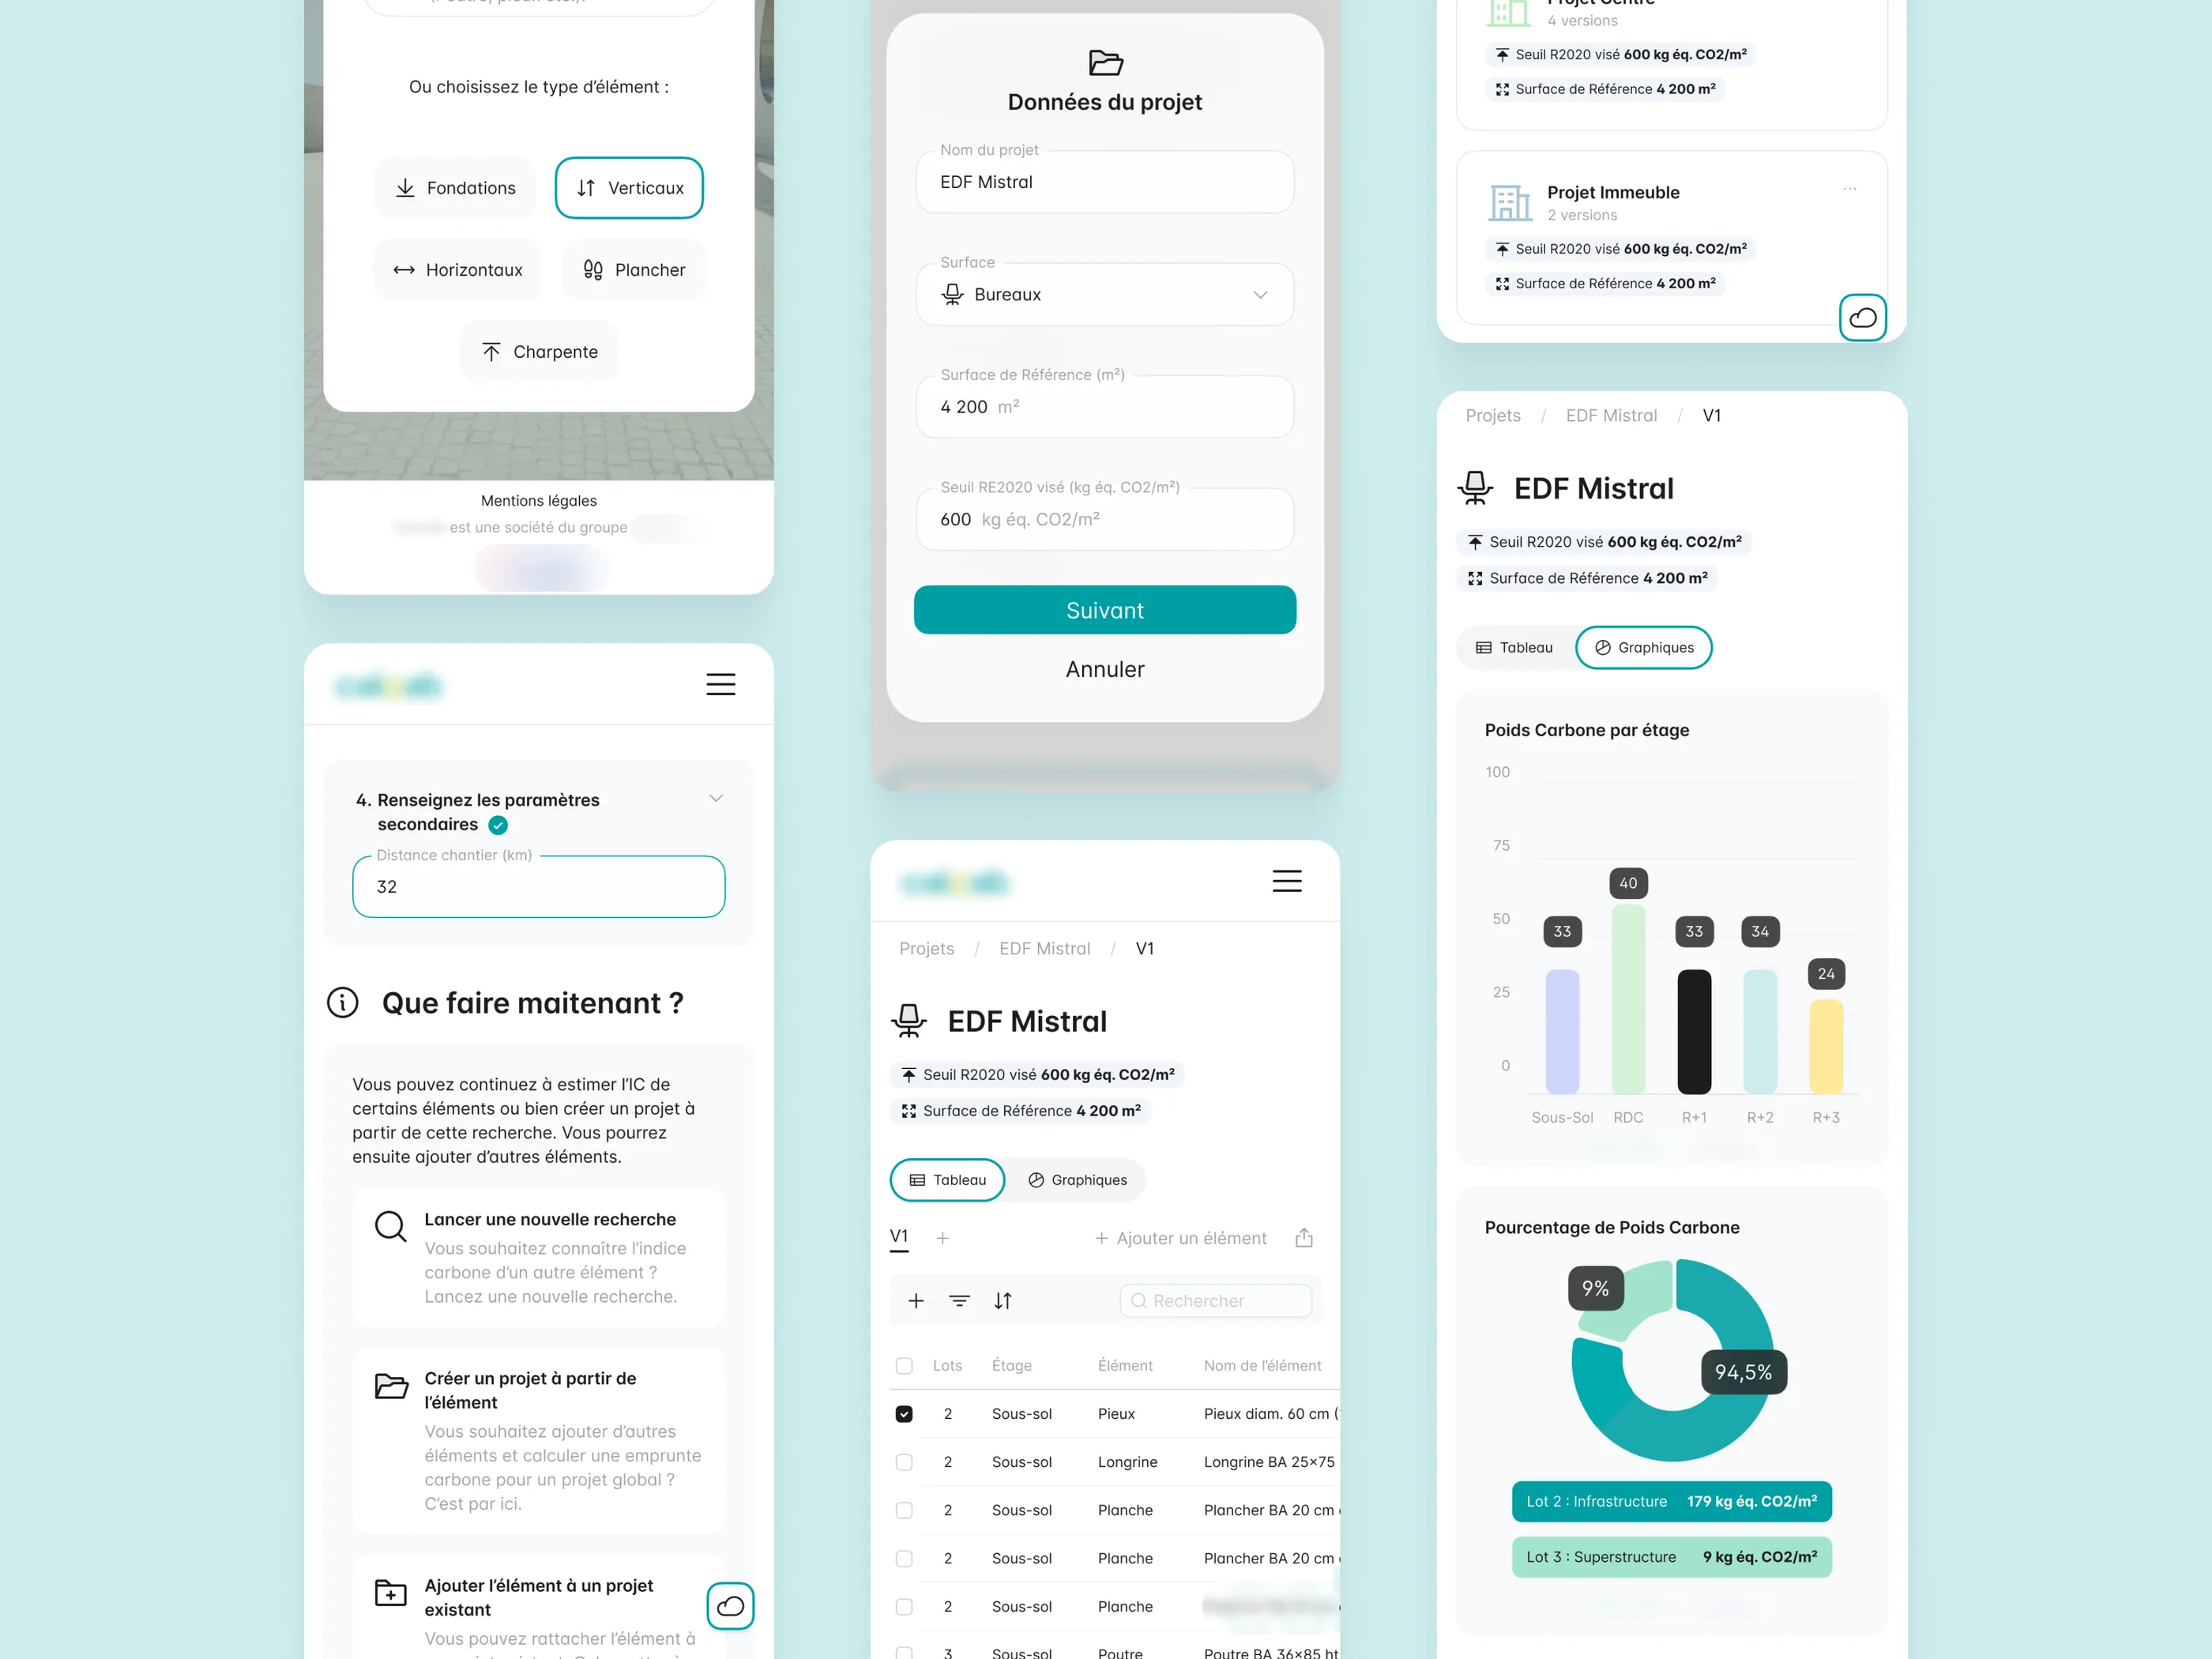
A few mobile screens
Lots of data, not much room 📱
That's the whole challenge with this kind of project: mobile isn't the priority, but people still need access to their data on the go.
I didn't reinvent the wheel: tools like Notion and Airtable have taught users to navigate data-heavy content on mobile (especially tables). So I added horizontal scrolling to the data-heavy sections.
Prototype testing confirmed that it works really well, even with large amounts of data.
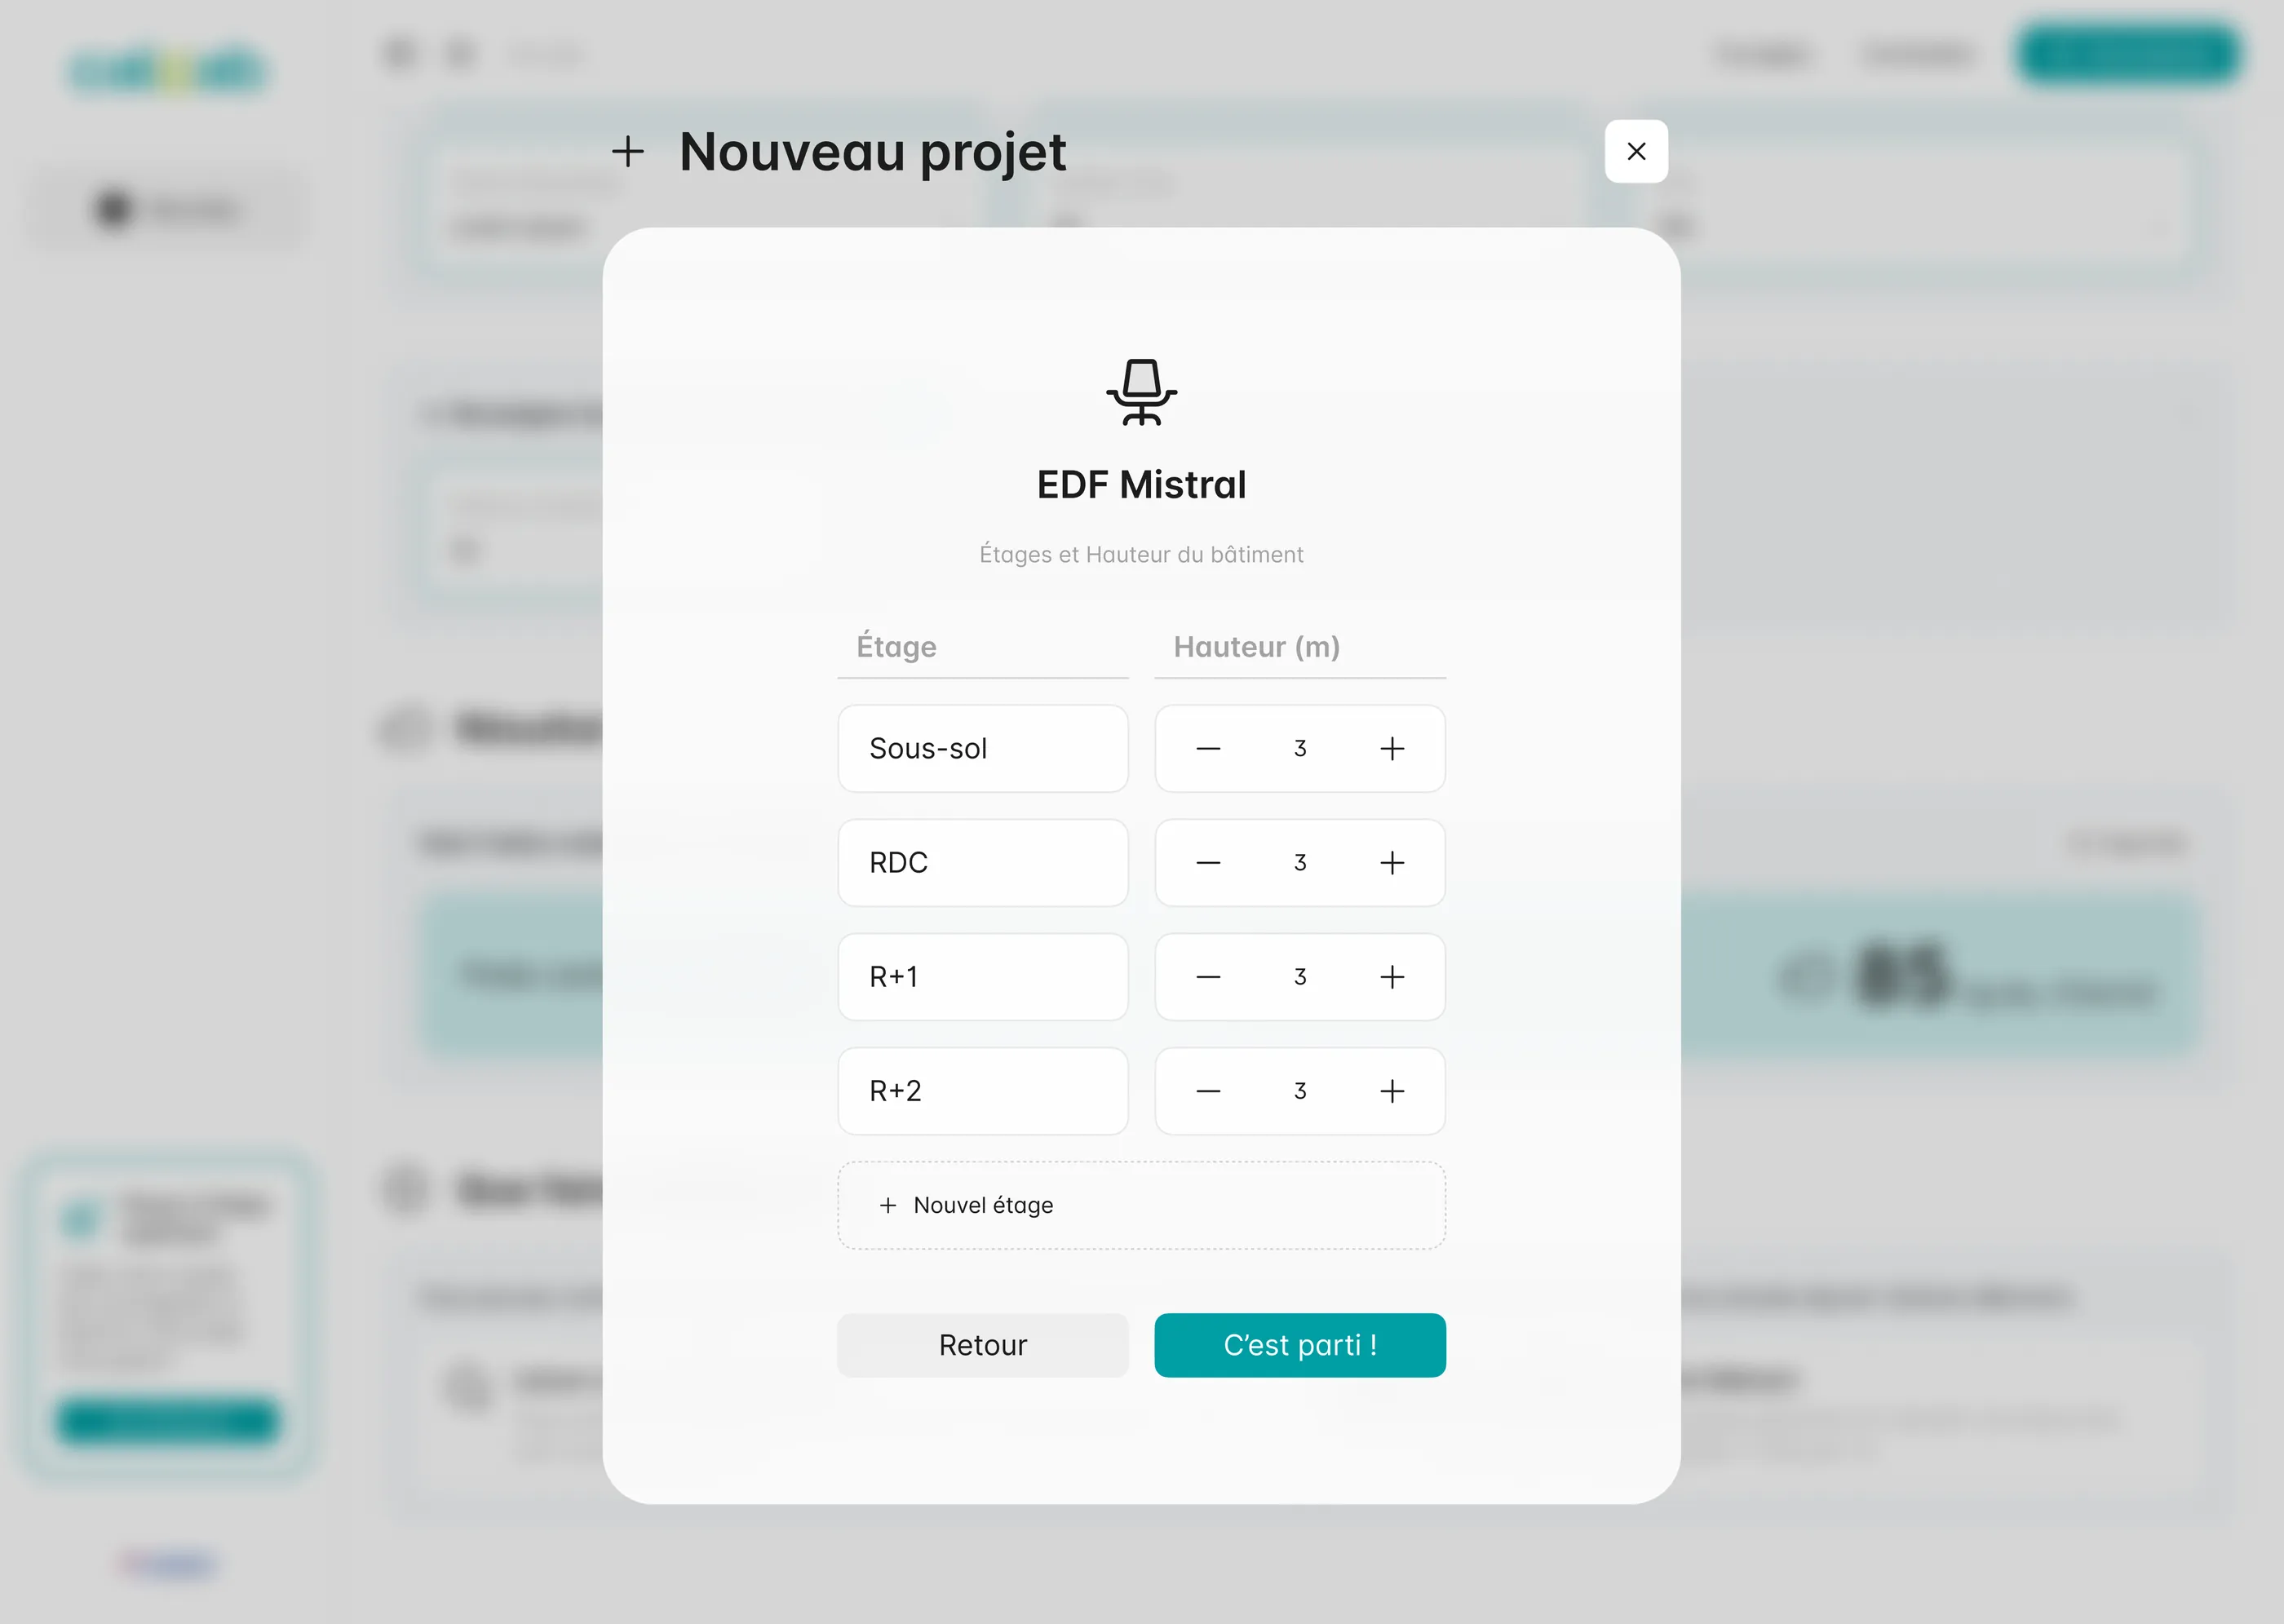
A small modal for adding a project. I usually avoid modals as much as possible, but here it's a good fit and highly relevant.
My work on this project
As a product designer, my work involved:
Designing a simple, clear and appealing user interface
Creating mockups for the different pages
Adapting the design for desktop and mobile devices
Incorporating client feedback on various aspects of the interface
Taking into account the specific needs of the target audience: structural engineers, architects, property developers and green building (HQE) professionals
The process involved several iterations and discussions with the client to refine the designs and make sure the app met the sector's specific needs while staying intuitive and efficient.
Wrapping up
A much more complex project than it first seemed. It was one of the first times I felt truly stuck. After an in-depth conversation with the client, I finally grasped the users' goals and got past that block. A great, rewarding experience.
 FREN
FREN